


RETIA » ReDAT Recording Systems » Application Platform ReDAT eXperience » Quality Management » ReDAT Dashboard
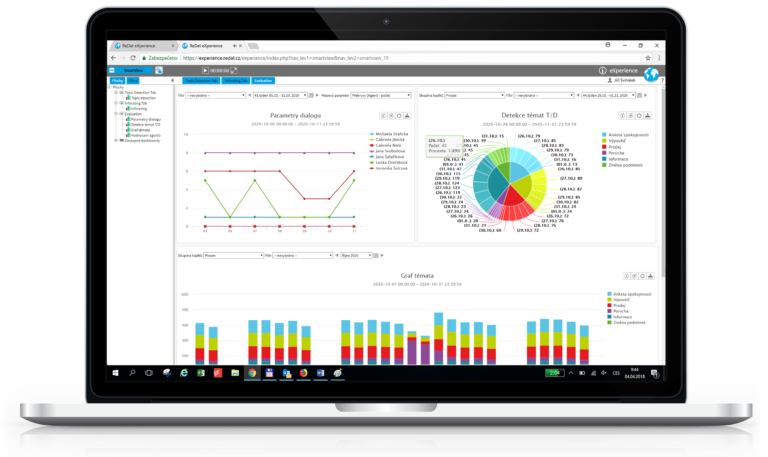
Dashboard is an indicator element (usually a graph) showing the changing status of the selected variables. Changing the value can be tied to the current time (on-line), or it may represent the state of the specified time interval.
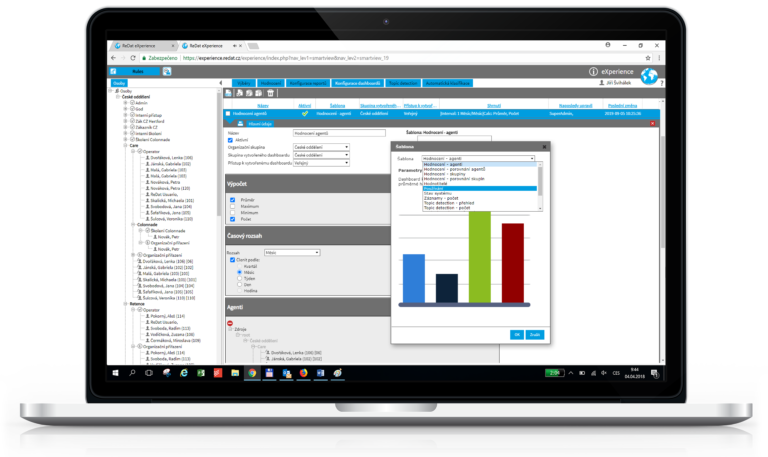
Dashboard is supplied with a set of templates that cover most of the user analysis. If needed, it is possible to modify or create an entirely new template according to the customer’s specifications.
Module is designed as intuitive, meaning that it is adapted for convenient and efficient creation of required dashboard. The system is based on predefined templates that will ensure the relevant data directly from the database, only definition of some basic variables (e.g. time scale, person, evaluation forms, etc.)
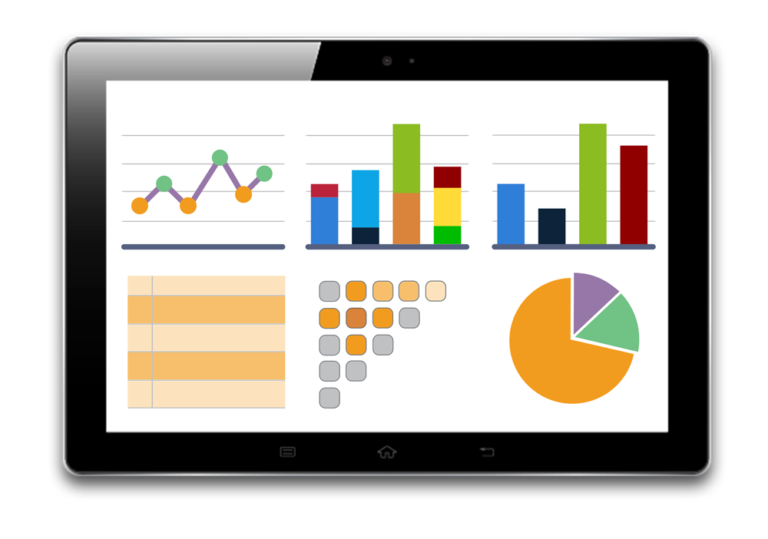
The SmartView application allows you to display configured dashboards. Here you can assign dashboards to individual areas and use the interactivity of their processing – change time ranges, display different types of graphs (pie, line, column, table…), work with the graph legend.
There is nothing easier, leave us your contact details and we will create access tailored to you, exactly according to your requirements.
We also believe that sometimes it is better to touch the environment properly.
RETIA, a.s.
Pražská 341
530 02 Pardubice
Czech Republic
Company ID: 25 25 19 29
Tax ID: CZ 699003219
+420 466 852 111
info@retia.cz

RETIA, a.s.
Pražská 341
530 02 Pardubice
Czech Republic
Company ID: 25 25 19 29
Tax ID: CZ 699003219
+420 466 852 111
info@retia.cz
| Cookie | Duration | Description |
|---|---|---|
| cookielawinfo-checkbox-advertisement | 1 year | Set by the GDPR Cookie Consent plugin, this cookie is used to record the user consent for the cookies in the "Advertisement" category . |
| cookielawinfo-checkbox-analytics | 1 year | Set by the GDPR Cookie Consent plugin, this cookie is used to record the user consent for the cookies in the "Analytics" category . |
| cookielawinfo-checkbox-functional | 1 year | The cookie is set by the GDPR Cookie Consent plugin to record the user consent for the cookies in the category "Functional". |
| cookielawinfo-checkbox-necessary | 1 year | Set by the GDPR Cookie Consent plugin, this cookie is used to record the user consent for the cookies in the "Necessary" category . |
| cookielawinfo-checkbox-others | 1 year | Set by the GDPR Cookie Consent plugin, this cookie is used to store the user consent for cookies in the category "Others". |
| cookielawinfo-checkbox-performance | 1 year | Set by the GDPR Cookie Consent plugin, this cookie is used to store the user consent for cookies in the category "Performance". |
| CookieLawInfoConsent | 1 year | Records the default button state of the corresponding category & the status of CCPA. It works only in coordination with the primary cookie. |
| elementor | never | This cookie is used by the website's WordPress theme. It allows the website owner to implement or change the website's content in real-time. |
| Cookie | Duration | Description |
|---|---|---|
| _ga | 2 years | The _ga cookie, installed by Google Analytics, calculates visitor, session and campaign data and also keeps track of site usage for the site's analytics report. The cookie stores information anonymously and assigns a randomly generated number to recognize unique visitors. |
| _gat_UA-43135777-1 | 1 minute | A variation of the _gat cookie set by Google Analytics and Google Tag Manager to allow website owners to track visitor behaviour and measure site performance. The pattern element in the name contains the unique identity number of the account or website it relates to. |
| _gid | 1 day | Installed by Google Analytics, _gid cookie stores information on how visitors use a website, while also creating an analytics report of the website's performance. Some of the data that are collected include the number of visitors, their source, and the pages they visit anonymously. |
| CONSENT | 2 years | YouTube sets this cookie via embedded youtube-videos and registers anonymous statistical data. |
| Cookie | Duration | Description |
|---|---|---|
| _fbp | 3 months | This cookie is set by Facebook to display advertisements when either on Facebook or on a digital platform powered by Facebook advertising, after visiting the website. |
| fr | 3 months | Facebook sets this cookie to show relevant advertisements to users by tracking user behaviour across the web, on sites that have Facebook pixel or Facebook social plugin. |
| VISITOR_INFO1_LIVE | 5 months 27 days | A cookie set by YouTube to measure bandwidth that determines whether the user gets the new or old player interface. |
| YSC | session | YSC cookie is set by Youtube and is used to track the views of embedded videos on Youtube pages. |
| yt-remote-connected-devices | never | YouTube sets this cookie to store the video preferences of the user using embedded YouTube video. |
| yt-remote-device-id | never | YouTube sets this cookie to store the video preferences of the user using embedded YouTube video. |
| yt.innertube::nextId | never | This cookie, set by YouTube, registers a unique ID to store data on what videos from YouTube the user has seen. |
| yt.innertube::requests | never | This cookie, set by YouTube, registers a unique ID to store data on what videos from YouTube the user has seen. |